Data Center Monitoring with AI: A Practical Guide to Data Logging, Energy Reporting, and Smart Lighting
Key Takeaways
| Topic | Summary |
|---|---|
| What is Data Logging? | Capturing environmental and system data over time for analysis |
| What is Energy Reporting? | Structured tracking of power consumption and energy-related metrics |
| Key Metrics | Includes PUE, CUE, and WUE for evaluating efficiency |
| Tools & Technologies | DCIM platforms, smart meters, sensors, and analytics dashboards |
| Role of AI/ML | Used for predictive energy usage and anomaly detection |
| CAE Lighting’s Contribution | Provides smart lighting with sensor integration to support efficiency |
| Implementation Best Practices | Involves planning, tool selection, deployment, and regular reviews |
| Common Challenges | Data overload, integration issues, and ROI balancing |
1. Why This Matters in 2025
Data centers are growing faster than rabbits on caffeine. And with that growth comes heat, power, and enough electricity use to light a small city. So, where does data logging fit into this chaos? Right at the heart.
We’ve installed sensor-triggered luminaires in facilities that forgot to track how hot their aisles got. One client in Johor saw a 17% spike in cooling costs — turns out their rack density increased, but no one updated the HVAC load. Logging data helps stop things like that.
- Real-time data helps identify inefficient zones
- Historical logs offer insight into gradual inefficiencies
- Lighting impact: Logging lux levels vs. occupancy patterns helps optimize light schedules
2. What Exactly Is Data Logging in a Data Center?
Imagine sensors that don’t sleep. They watch temperatures rise, voltages spike, humidity creep. And they write it all down.
- Temperature Sensors: Usually placed at the front and back of racks
- Energy Meters: Track the real draw from PDUs
- Humidity Probes: Help avoid corrosion and static discharge
- Network Monitors: Flag spikes in traffic or downtime clusters
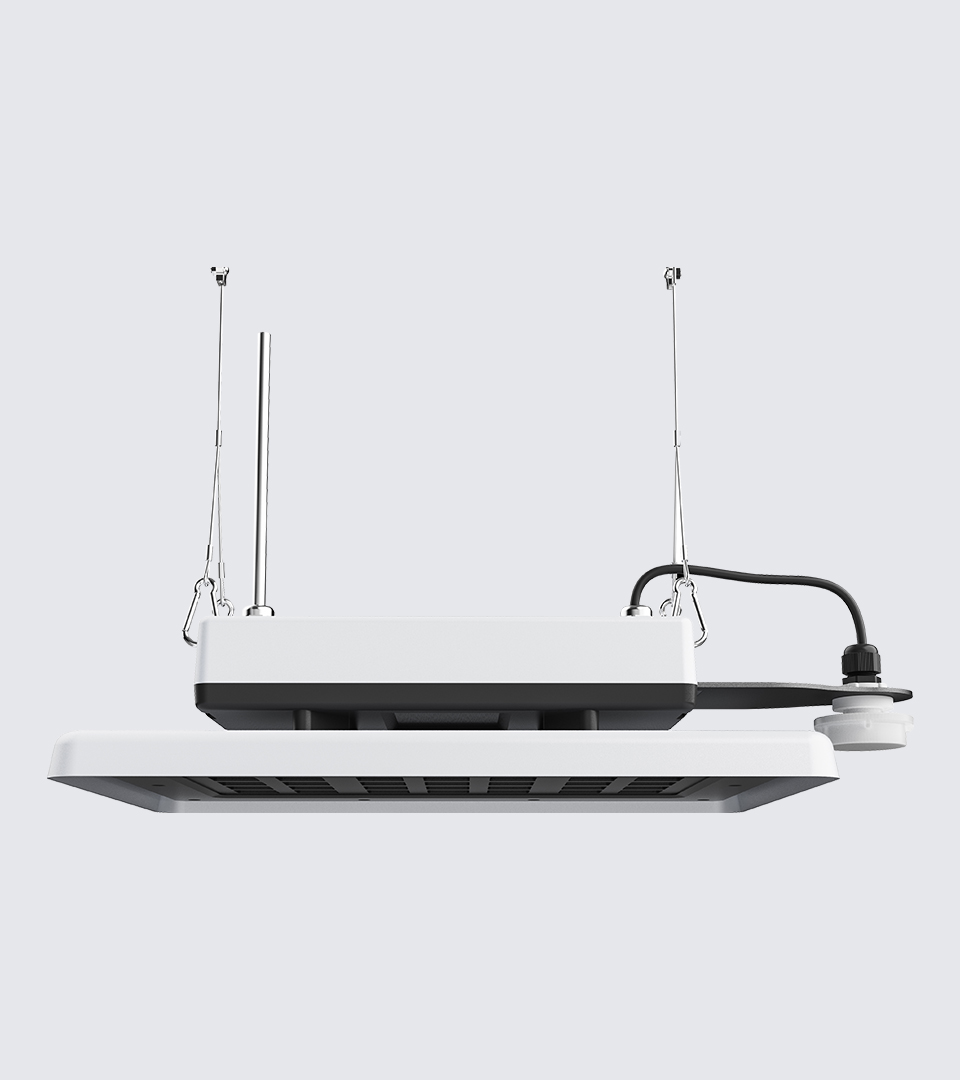
CAE Lighting integrates data-capable lighting like the Squarebeam Elite that tracks occupancy and triggers logs when zones go active.
3. Energy Reporting: More Than Just a Spreadsheet
Energy reporting isn’t just printing out kilowatt numbers. It’s a map of where power flows and where it leaks.
| Metric | Meaning |
|---|---|
| PUE | Total facility energy / IT energy consumption |
| CUE | Carbon emissions per IT energy unit |
| WUE | Liters of water per kWh used |
We had a client using the Seamline Batten to illuminate cool aisles. Pairing energy reports with occupancy sensors helped them identify underused rows that could be shut off entirely.

4. Where Logging Meets Reporting
- Logs show temp spike at Row 7 at 3 AM
- Energy report confirms fan units spiked too
- Action: Adjust cooling direction, replace blocked airflow panel
That’s where tools like Sunbird DCIM or CAE’s motion-controlled systems tie in perfectly.
5. Tools and Tech That Actually Work
- Sensors: KEYENCE, Schneider, Legrand
- Platforms: Sunbird, Device42, CAE custom DC lighting dashboards
- Lighting Fixtures: Like the SeamLine Batten with trigger-and-track logic
6. AI & ML: Not Hype If Used Right
- Machine Learning: Identifies patterns before humans notice
- AI Dashboards: Suggest optimal workload distributions
- Smart Lighting: Adjust brightness levels to save watts when no one’s around
7. How to Actually Set This Up
- Audit existing lighting and HVAC data points
- Choose sensors that match load, scale, and update rate
- Install and calibrate (don’t skip this step!)
- Connect to platform (cloud or local)
- Create alert profiles for actionable events
8. Common Problems You Can Avoid
- Data Flooding: Too many logs, no structure
- False Alerts: Sensors not calibrated to tolerance levels
- Misconfigured Thresholds: Cause panic or worse, silence
The fix? Simpler systems with smart defaults. CAE Lighting designs its luminaires to avoid this trap by logging only when changes are meaningful.
Frequently Asked Questions
- What is the difference between logging and reporting?
Logging is data collection. Reporting is data interpretation. - What metrics should I track in my data center?
At minimum: PUE, CUE, WUE, and real-time load per rack or circuit. - Can lighting systems really contribute to energy reporting?
Yes. Especially motion-triggered and dimmable lighting connected to smart meters. - What’s the fastest way to start logging?
Begin with a lighting system like Squarebeam Elite that includes sensor integration, then expand into DCIM platforms. - Is AI worth the investment?
If you have variable loads or legacy systems — yes. Predictive maintenance alone can justify the cost.
For more on how CAE Lighting integrates logging-ready LED systems into mission-critical facilities, visit our product overview.